Gauging code complexity by visualizing SLOC metrics
• 587 words • ~3 min read ⏲
I recently experimented a bit with lunr.js, because I wanted to learn a bit about information retrieval techniques, by trying to read the codebase in depth. The library itself is comparatively small, since it doesn't aim to be everything to everyone, but still it delivers a complete feature set, which is more than a mere toy program, which makes it a great study object in my books.
What I like to do, in order to get a high-level overview and an idea on which parts I should focus, is to look at the SLOC (source lines of code) metrics. Now, this metric has a bit of a bad reputation, which stems from the days when it was used by the wrong people for the wrong reason (an in: by managers to measure developer productivity). I don't want to waste too much effort on elaborating why this is a bad idea, just so much: that is a textbook example of Goodhart's law in action.
Anyway, SLOC is easy to understand, quick to gather, agnostic of programming language, and a pretty good proxy for complexity. There is even research that suggests, that SLOC and the more complicated to measure Cyclomatic_complexity metrics, actually measure the same property
.
There are several tools available to do the actual counting. I like Al Danial's cloc because it has a lot of options and output formats available. Curtis Gagliardi's loc claims to be two orders of magnitude faster than cloc, but on small to mid-sized repositories, the execution speed is not really a limiting factor, the missing JSON output option on the other hand is, .
Having said that, the output of running cloc on lunr is the following:
-------------------------------------------------------------------------
File                                  blank        comment           code
-------------------------------------------------------------------------
./token_set.js                           57            146            212
./query_parser.js                        49              0            206
./index.js                               56            239            197
./stemmer.js                             27             25            171
./builder.js                             45            153            162
./query_lexer.js                         38             18            153
./stop_word_filter.js                     4             30            131
./pipeline.js                            33            139             95
./vector.js                              26             76             94
./set.js                                 22             42             69
./match_data.js                          16             33             58
./query.js                               21            111             56
./token_set_builder.js                   15              2             52
./utils.js                               10             44             38
./tokenizer.js                           11             29             36
./field_ref.js                            7              0             21
./token.js                                4             39             15
./lunr.js                                 4             31             14
./idf.js                                  4              8              9
./query_parse_error.js                    1              0              7
./trimmer.js                              2             19              6
-------------------------------------------------------------------------
SUM:                                    452           1184           1802
-------------------------------------------------------------------------
But as a wall of text and numbers is not the most intiutive representation, I exported the cloc result to json (cloc . --by-file --json) and adapted the template for circular packing from the D3.js Graph Gallery to plot the output of cloc. Also, I did a second plot, where SLOC are adjusted by a factor determined of how heavily the code is commented (with the reasoning that a lot of comment indicate complex logic). The output looks like this:
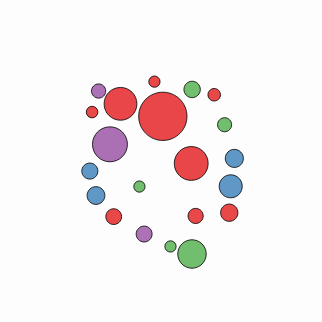

Keep in mind, the intention of it was to be a quick gauge of a small code base. Which means it is not too economical to play with visualization features too much. One can see that the core data structures (drawn in red, especially index and token set) account for over 20% of the code base, but also the query language (in light green), which actually is a mere convenience feature and would actually be omittable, make up a similar portion. Also notably, the stemmer, which is a crucial module to actually build the index, is a inlined third-party implementation of Martin Porters stemming algorithm. In the second visualization this gets dialed down in size a lot, because the implementation does not make much use of comments, although it is very dense, full of regexes and short variable names.
But the fact that a map mustn't be confused with the territory doesn't render maps useless.